The iron-carbon diagram is usually taught as a thing to memorise, which is why most people leave a materials course able to label it and unable to use it.
It is really a map with three lines and one point that matter. Learn those, learn to trace a vertical line down through them, and you can predict what a steel’s microstructure will look like — and, more importantly, notice when it will not.
By the end of this post you will be able to read a cooling path, calculate how much of each phase you get, and say why the diagram stops being useful the moment someone quenches the part.
In this post:
- The four things worth memorising
- The three phases, and what each one is
- Tracing a cooling path
- The lever rule, worked twice
- Where the diagram stops telling the truth
The four things worth memorising
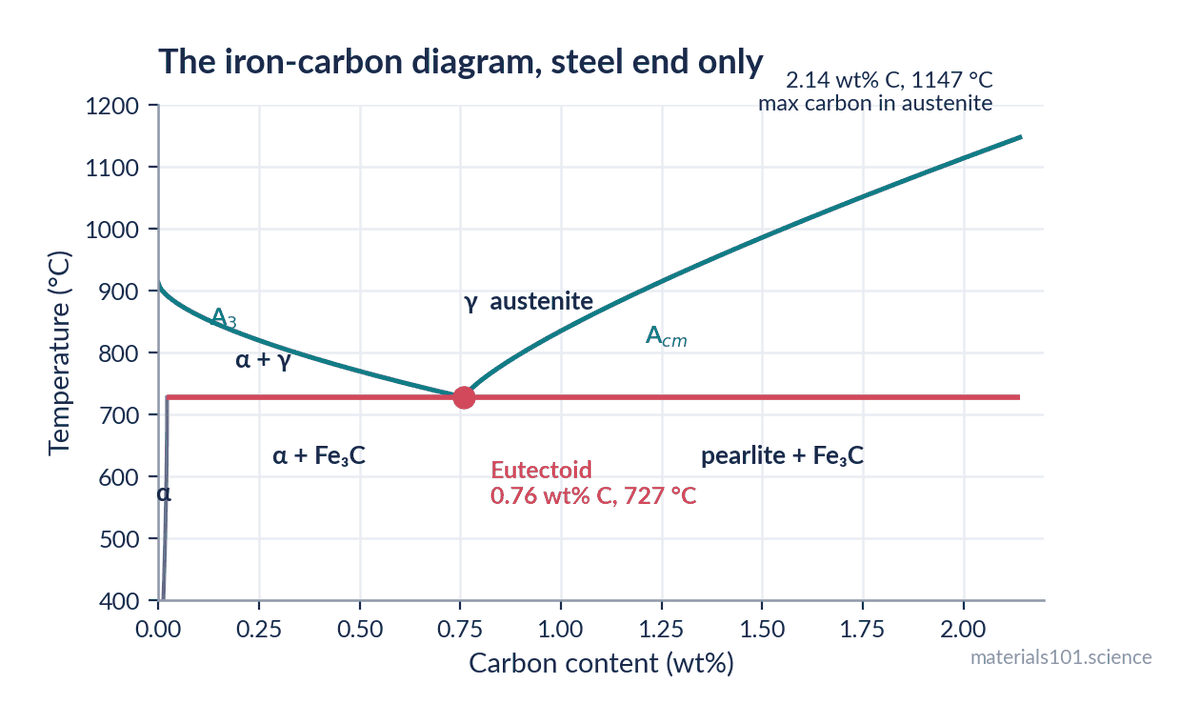
727 °C — the eutectoid temperature (A₁). Below this, austenite cannot exist in a plain carbon steel. Every steel heat treatment is defined relative to it.
0.76 wt% C — the eutectoid composition. A steel at exactly this carbon content transforms entirely to pearlite. Below it the steel is hypoeutectoid; above it, hypereutectoid.
2.14 wt% C at 1147 °C — the maximum carbon austenite can dissolve. This is the dividing line between steel and cast iron. Not a convention: above it you cannot get a single-phase austenite at any temperature, which changes everything about how the alloy is processed.
912 °C — pure iron’s α → γ transformation. The left-hand end of the A₃ line, where BCC ferrite becomes FCC austenite.
Four numbers. Everything else on the diagram can be reconstructed from the shape.
The three phases
Ferrite (α) — BCC iron. Dissolves very little carbon: a maximum of about 0.022 wt% at 727 °C, and almost nothing at room temperature. Soft, ductile, magnetic. It is nearly pure iron, and that is why it is soft.
Austenite (γ) — FCC iron. Dissolves up to 2.14 wt% C, roughly a hundred times more than ferrite. This single fact is the basis of steel heat treatment: heat into austenite, dissolve the carbon, then control how it comes back out. Non-magnetic, and not stable below 727 °C in a plain carbon steel.
Why does FCC hold so much more carbon than BCC when FCC is the denser packing? Because carbon sits in interstitial holes, and FCC’s octahedral holes are larger and fewer, while BCC’s are smaller and more numerous. Carbon cares about the size of the biggest available hole, not the total free volume.
Cementite (Fe₃C) — iron carbide, 6.67 wt% C, orthorhombic, hard and brittle. Strictly it is metastable: given geological time it would decompose to iron and graphite. On any human timescale it behaves as a stable phase, which is why the diagram is drawn with it.
Pearlite is not a phase. It is a microstructure: alternating lamellae of ferrite and cementite that form together when austenite at the eutectoid composition transforms. Calling pearlite a phase is the single most common error in exam answers.
Tracing a cooling path
Take a 0.4 wt% C steel — an ordinary medium-carbon grade — and cool it slowly from 900 °C. Draw a vertical line at 0.4 wt% and read what it crosses.
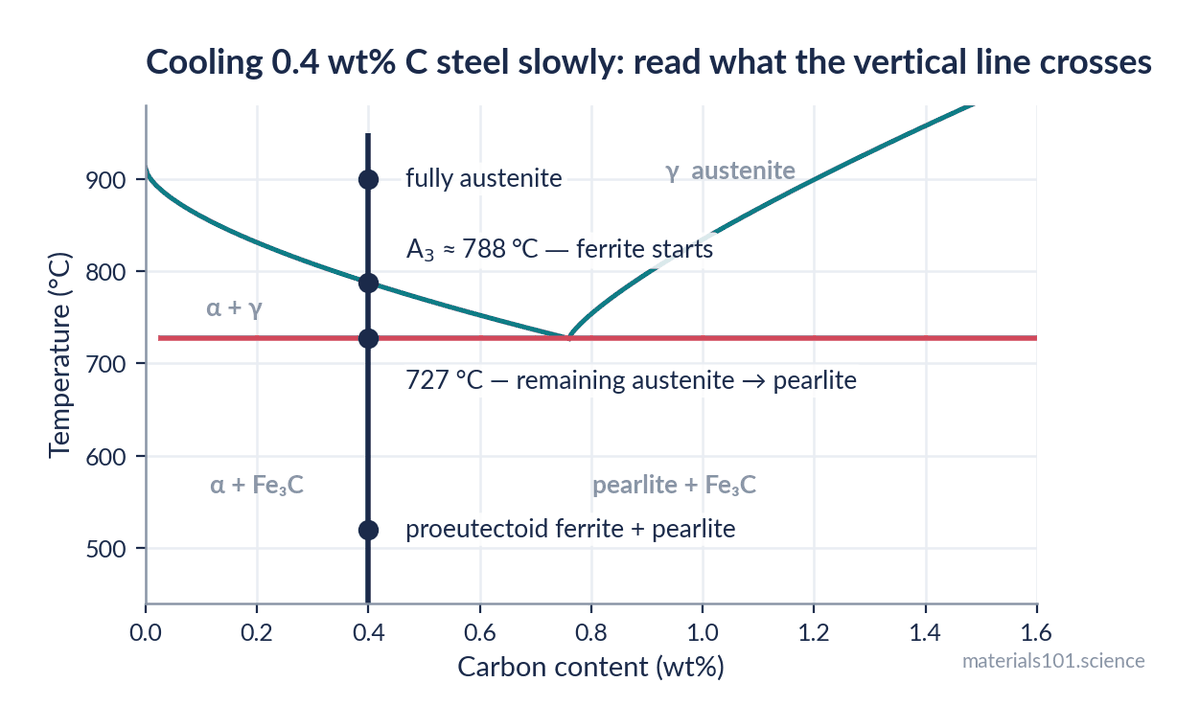
At 900 °C — fully austenite. One phase, carbon dissolved uniformly.
Crossing A₃ at about 790 °C — ferrite starts to nucleate, preferentially at austenite grain boundaries. This ferrite is nearly carbon-free, so the carbon it rejects enriches the remaining austenite. As cooling continues, more ferrite forms and the leftover austenite gets progressively richer in carbon.
Just above 727 °C — the remaining austenite has been enriched all the way to 0.76 wt%, the eutectoid composition, by definition of where the A₃ line lands.
At 727 °C — that remaining austenite transforms all at once into pearlite.
Below 727 °C — nothing much changes. The final structure is proeutectoid ferrite (formed above 727 °C) plus pearlite (formed at 727 °C).
That is the whole method: find which two-phase field you are in, and remember that the phase forming first rejects what it cannot dissolve into whatever is left.
The lever rule, worked twice
The lever rule converts “which phases” into “how much of each”. At any point in a two-phase field, draw a horizontal tie line to the boundaries either side. The fraction of each phase is the opposite segment divided by the total — which is why it is called a lever.
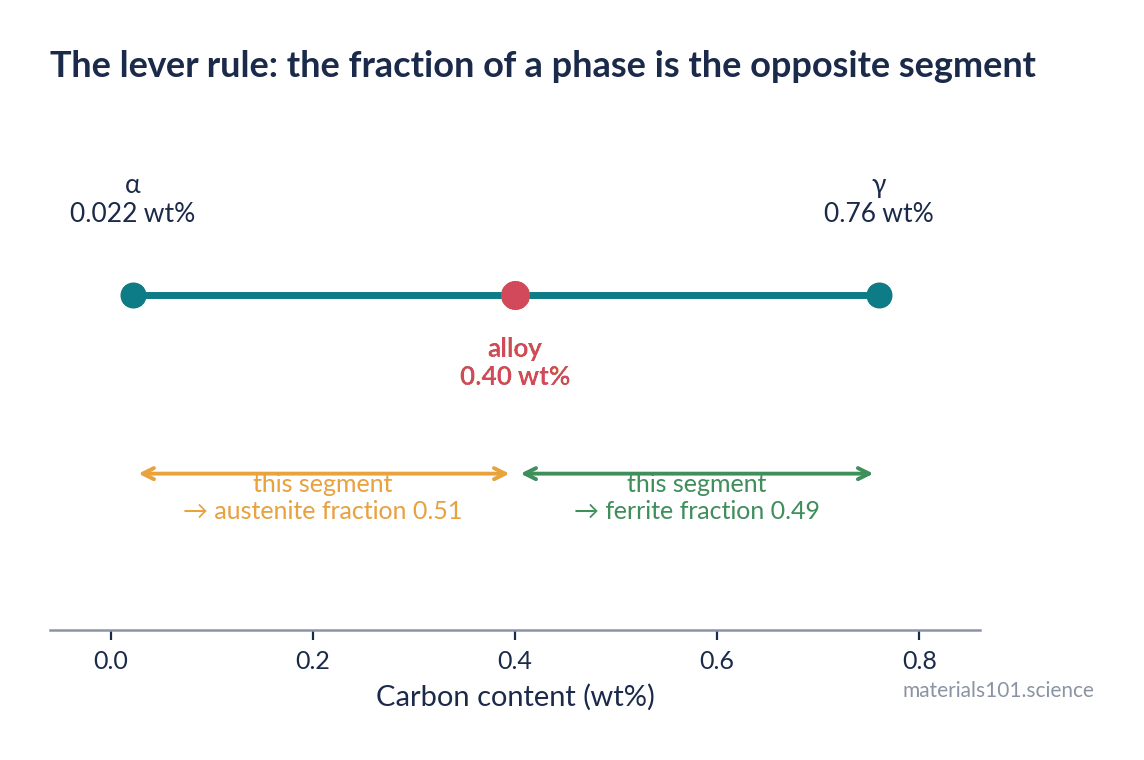
Worked example 1 — just above 727 °C, in 0.4 wt% C steel. The tie line runs from ferrite at 0.022 wt% to austenite at 0.76 wt%.
W_ferrite = (0.76 − 0.40) / (0.76 − 0.022) = 0.36 / 0.738 = 0.49
So just before the eutectoid reaction, about 49% of the steel is proeutectoid ferrite and 51% is austenite about to become pearlite.
Worked example 2 — just below 727 °C. Now the tie line runs from ferrite at 0.022 wt% to cementite at 6.67 wt%.
W_total ferrite = (6.67 − 0.40) / (6.67 − 0.022) = 6.27 / 6.648 = 0.943
W_cementite = 1 − 0.943 = 0.057
The steel is 94% ferrite and 6% cementite by mass — and that 6% of hard, brittle carbide, arranged as lamellae inside pearlite, is what gives medium-carbon steel its strength. Six percent of the right phase in the right arrangement is worth more than any amount in the wrong one.
Going deeper
Two traps in lever-rule problems. First, use mass fractions, not atomic percent; the Fe-C diagram is conventionally drawn in weight percent and mixing the two is the commonest arithmetic error. Second, be clear whether you are asked for total ferrite or proeutectoid ferrite. Total ferrite includes the ferrite inside pearlite; proeutectoid ferrite is only what formed above 727 °C. In the example above those are 94% and 49% — wildly different answers to questions that sound almost identical.
Where the diagram stops telling the truth
This is the part that matters in practice, and it is usually a footnote in the textbook.
The Fe-C diagram is an equilibrium diagram. Every phase boundary assumes carbon has had unlimited time to diffuse. Cool a steel quickly and that assumption fails, and the diagram’s predictions fail with it.
Quench a 0.4 wt% C steel into water from 900 °C and you do not get ferrite plus pearlite. You get martensite — a supersaturated body-centred tetragonal structure that appears nowhere on the diagram, because it is not an equilibrium phase. It forms by a diffusionless shear: the lattice changes shape without any atom moving more than a fraction of a bond length, trapping carbon where it stands.
Cool at an intermediate rate and you get bainite, which is also absent from the diagram.
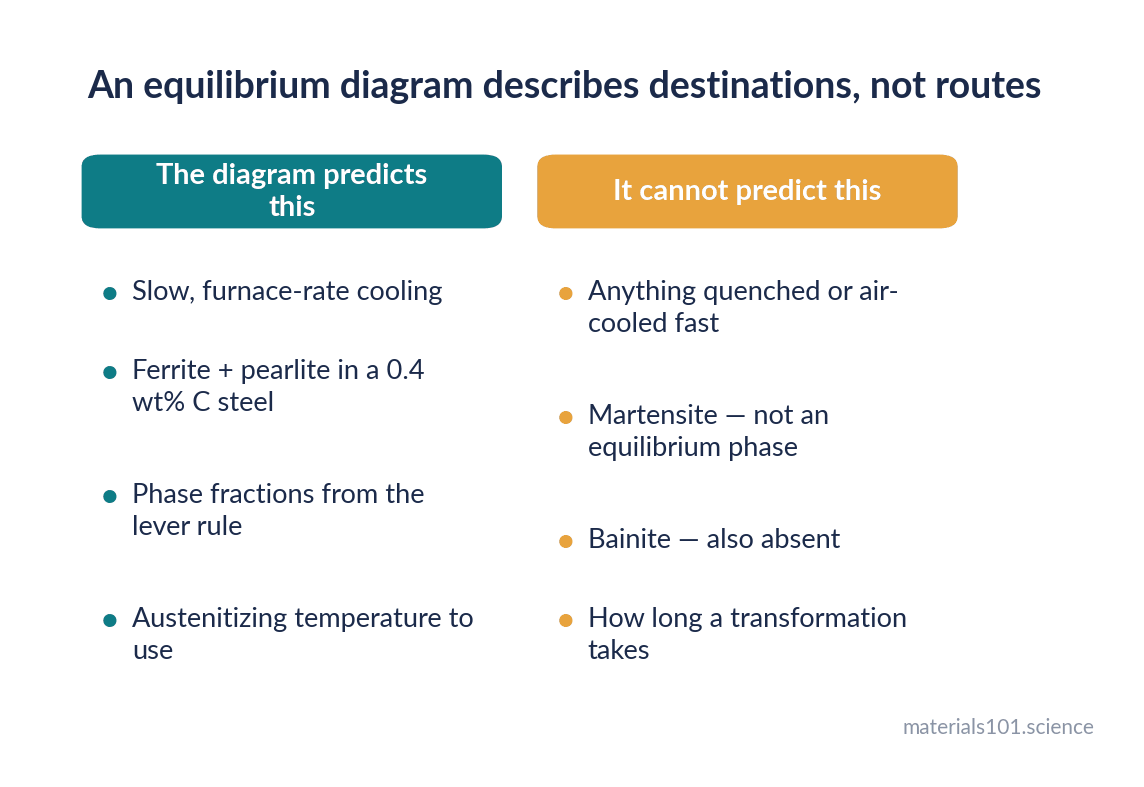
So the Fe-C diagram tells you the destination if you go slowly enough, and nothing about the route. For the route you need a TTT diagram (isothermal transformation) or a CCT diagram (continuous cooling). The Fe-C diagram remains essential because it fixes the austenitizing temperature and tells you what carbon content you are working with — but it cannot predict the microstructure of a quenched part.
In practice
Three ways this gets used on real work. Setting austenitizing temperature: 30–50 °C above A₃ for the actual carbon content, which you read off the diagram. Interpreting a micrograph: measure the fraction of pearlite, run the lever rule backwards, and you have an estimate of carbon content — a quick cross-check on a mill certificate. Explaining a failure: a hypereutectoid steel cooled slowly forms cementite on the prior austenite grain boundaries, a continuous brittle network that is a classic cause of unexpected fracture, and the diagram tells you to expect it above 0.76 wt% C.
Common misconceptions
- “Pearlite is a phase.” It is a two-phase microstructure of ferrite and cementite. Phases are ferrite, austenite and cementite.
- “Steel becomes non-magnetic when hot because it is hot.” It becomes non-magnetic because it becomes austenite, which is FCC and paramagnetic — and this is genuinely how blacksmiths judge austenitizing temperature with a magnet.
- “Martensite is on the diagram somewhere.” It is not, and cannot be: it is not an equilibrium phase.
- “More carbon always means stronger steel.” Up to a point. Past the eutectoid, cementite networks on grain boundaries make the steel brittle, which is why most structural steels sit well below 0.76 wt% C.
Key takeaways
- Four numbers carry the diagram: 727 °C, 0.76 wt% C, 2.14 wt% C at 1147 °C, and 912 °C.
- Austenite dissolves about a hundred times more carbon than ferrite, and that single asymmetry is the basis of all steel heat treatment.
- Pearlite is a microstructure, not a phase.
- The lever rule gives phase fractions; be clear whether the question asks for total or proeutectoid ferrite.
- The diagram assumes equilibrium. Martensite and bainite are absent from it, so a quenched microstructure needs a TTT or CCT diagram instead.
Frequently asked questions
What does the iron-carbon phase diagram show?
Which phases — ferrite, austenite, cementite — are stable at a given carbon content and temperature, and in what proportions. It assumes equilibrium, so it describes slow cooling.
What is the significance of 727 °C?
It is the eutectoid temperature, the lowest temperature at which austenite can exist in a plain carbon steel. Austenite at 0.76 wt% C transforms to pearlite there, and every heat treatment is specified relative to it.
What is the difference between hypoeutectoid and hypereutectoid steel?
Hypoeutectoid steel has less than 0.76 wt% C and forms proeutectoid ferrite before the eutectoid reaction. Hypereutectoid steel has more, and forms proeutectoid cementite instead — often as a brittle network on grain boundaries.
Why can austenite hold more carbon than ferrite?
Because carbon sits in interstitial holes, and although FCC austenite is more densely packed overall, its octahedral interstices are individually larger than anything available in BCC ferrite. Carbon cares about the size of the largest hole, not the total free volume.
Why is martensite not on the iron-carbon diagram?
Because it is not an equilibrium phase. It forms by a diffusionless shear during rapid cooling, and equilibrium diagrams only show phases that form when diffusion has had enough time. Use a TTT or CCT diagram for quenching.
Next read
- Annealing vs normalizing vs tempering — using the diagram to specify a real heat treatment
- BCC vs FCC vs HCP: why crystal structure decides ductility — why FCC and BCC iron behave so differently
References
The phase diagram is drawn from the standard invariant points of the Fe-C system;
the lever-rule examples are computed in the text and can be checked by hand.
- W. D. Callister and D. G. Rethwisch, Materials Science and Engineering: An Introduction, 10th ed., Wiley, 2018 — Fe-C invariant points, the lever rule, pearlite formation.
- G. Krauss, Steels: Processing, Structure, and Performance, 2nd ed., ASM International, 2015 — austenite carbon solubility, proeutectoid phases, grain-boundary cementite.
- ASM International, ASM Handbook, Volume 3: Alloy Phase Diagrams, 1992 — the reference Fe-C diagram and its assessed boundaries.
- H. K. D. H. Bhadeshia and R. W. K. Honeycombe, Steels: Microstructure and Properties, 4th ed., Butterworth-Heinemann, 2017 — why martensite and bainite are absent from the equilibrium diagram.
Written by Dinesh Varma, PhD scholar in computational materials science.
Spotted an error? Tell me — corrections are credited.